Format aesthetics for the supplementary (new) biplot axes
newaxes.RdThis function allows the user to format the aesthetics for the supplementary (new) biplot axes.
Usage
newaxes(bp, X.new.names=bp$var.names, which = 1:bp$num.vars, col = "orange", lwd = 1,
lty = 1, label.dir = NULL, label.col = col, label.cex = 0.75, label.line = 0.1,
ticks = 5, tick.col = col, tick.size = 1, tick.label = TRUE, tick.label.col = tick.col,
tick.label.cex = 0.6, tick.label.side = "below", predict.col = col, predict.lwd = lwd,
predict.lty = lty, ax.names = X.new.names, orthogx = 0, orthogy = 0)
Arguments
- bp
an object of class
biplot.- X.new.names
a vector of the new column names of
bpto specify which axes should be labelled.- which
a vector containing the new columns or variables for which the axes should be displayed, with default
1:num.vars.- col
the colour(s) for the axes, with default
grey(0.7). Alternatively, provide a vector of colours corresponding toX.names.- lwd
the line width(s) for the axes, with default
1.- lty
the line type(s) for the axes, with default
1.- label.dir
a character string indicating the placement of the axis titles. One of "
Along" for axis titles to appear alongside the axis line itself, rotated to the slope of the axis, "Orthog" for axis titles to appear orthogonal to the side of the figure, "Hor" for axis titles to appear horizontally or "Paral" for axis titles to appear parallel to the side of the figure. The defaultNULLuses "Along" with theggplot2engine and "Orthog" with base graphics.- label.col
the colour(s) for the axis labels, with default,
col.- label.cex
the label expansion for the axis labels, with default
0.75.- label.line
the distance of the axis title from the side of the figure, with default
0.1.- ticks
an integer-valued vector indicating the number of tickmarks for each axis, with default
5for each axis.- tick.col
the colour(s) for the tick marks, with default
col.- tick.size
a vector specifying the sizes of tick marks for each axis, with default
1for each .- tick.label
a logical value indicating whether the axes should be labelled, with default
TRUE.- tick.label.col
the colour(s) for the tick mark labels, with default
tick.col.- tick.label.cex
the label expansion for the tick mark labels, with default
0.6.- tick.label.side
a character string indicating the position of the tick label. One of "
below" for the label to appear below the tick mark (default) or "above" for the label to appear above the tick mark.- predict.col
the colour(s) for the predicted samples, with default
col.- predict.lwd
the line width(s) for the predicted samples, with default
lwd.- predict.lty
the line type(s) for the predicted samples, with default
lty.- ax.names
a vector of size
pcontaining user defined titles for the axes.- orthogx
a numeric vector of size
pspecifying the x-coordinate of the parallel transformation of each axis, with default0for each axis. This is only used whendim.biplot = 2.- orthogy
a numeric vector of size
pspecifying the y-coordinate of the parallel transformation of each axis, with default0for each axis. This is only used whendim.biplot = 2.
Value
The object of class biplot will be appended with a list called newaxes containing elements similar to that of axes.
Examples
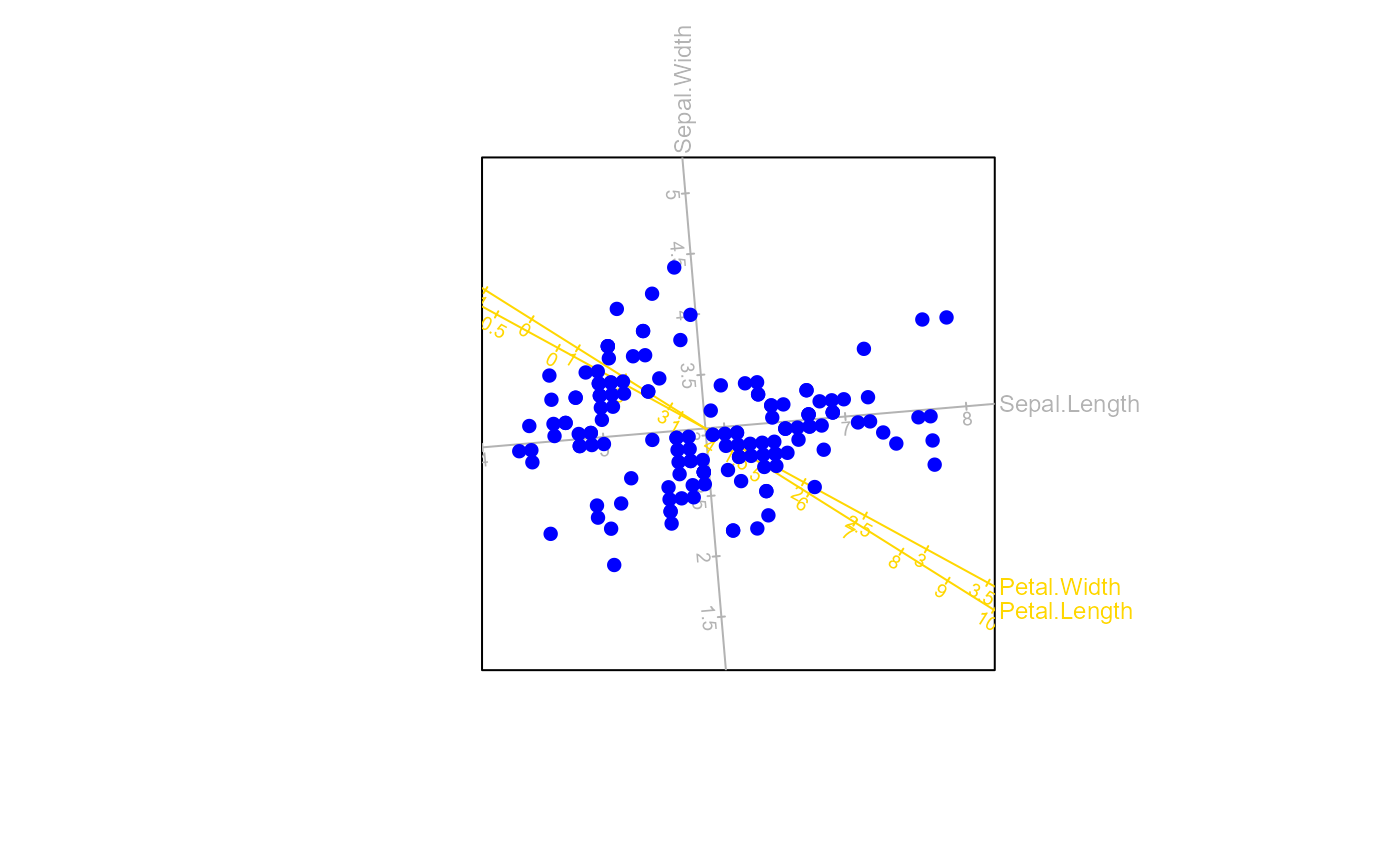
biplot(data = iris[,1:2]) |> PCA() |> interpolate(newvariable = iris[3:4]) |>
  newaxes(col="gold") |> plot()