Interpolate supplementary points and variables to add to the biplot
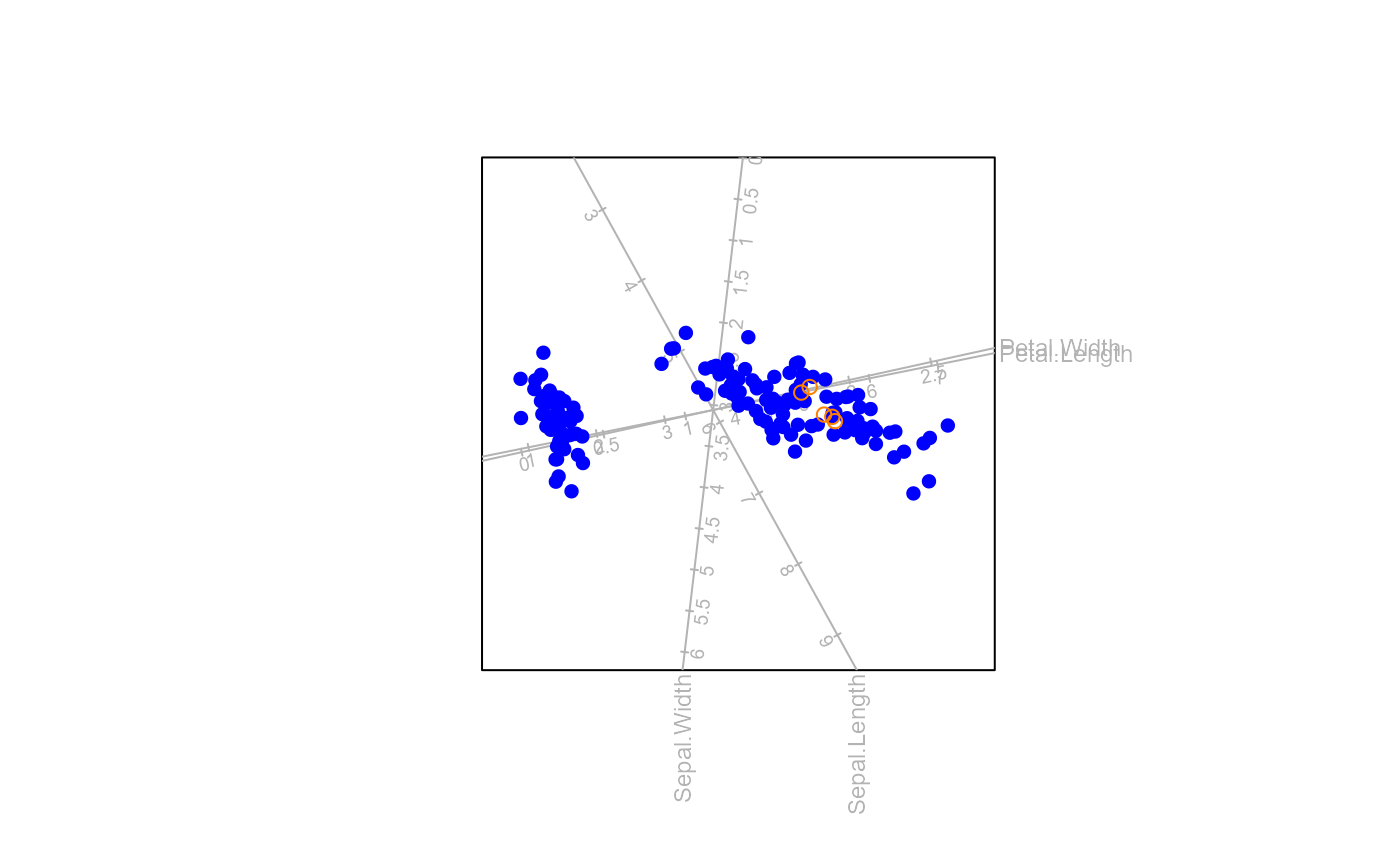
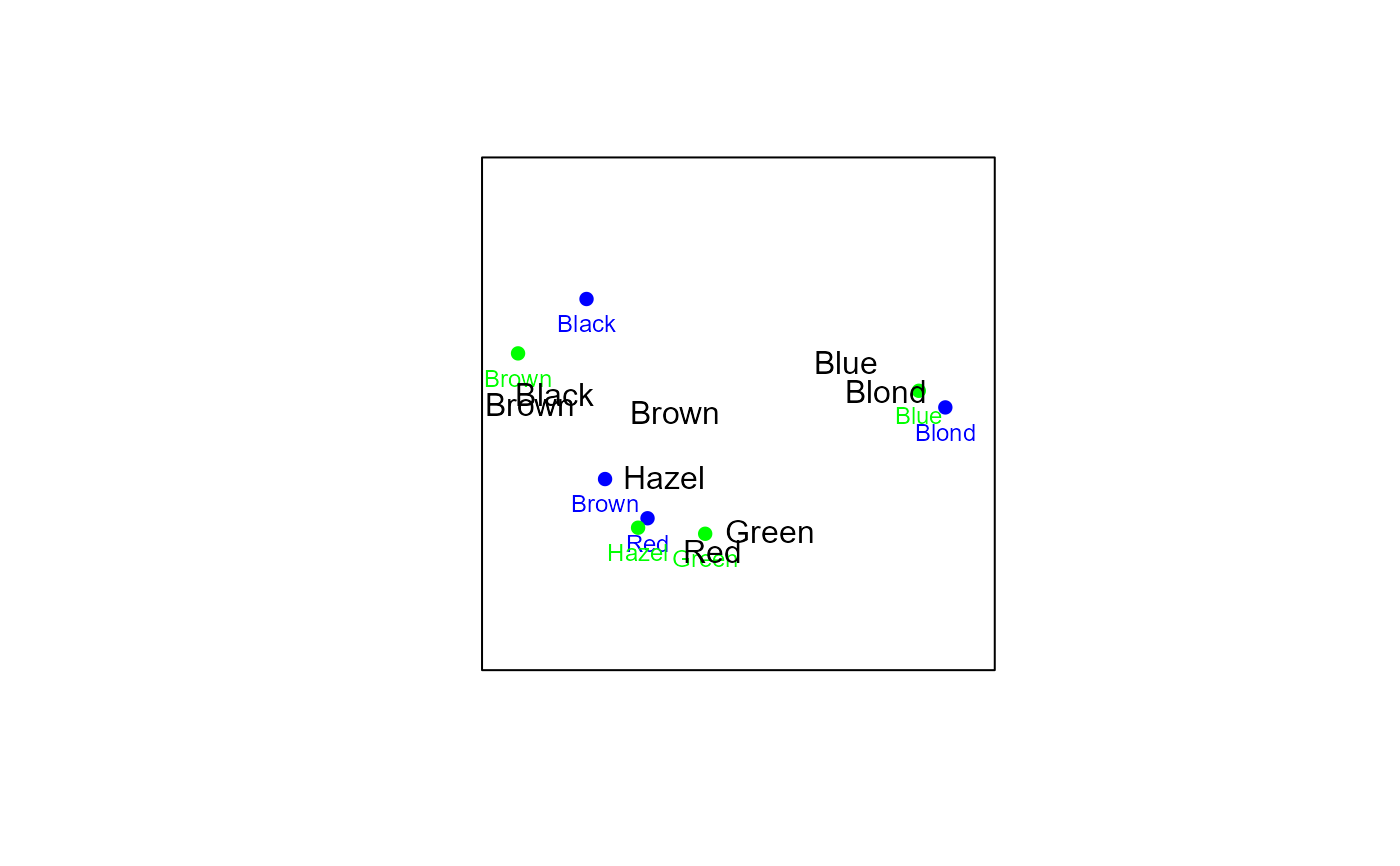
interpolate.RdThis function adds supplementary points and variables to the plot from a new data set.
Arguments
- bp
an object of class
biplotobtained from preceding functionbiplot().- newdata
a new data set, similar in structure to the data set supplied to
biplot()containing supplementary data points to be added onto the biplot.- newvariable
a new data set, similar in structure to the data set supplied to
biplot()containing supplementary variables to be added onto the biplot.- new.group.aes
aesthetics for the new samples
Value
The object of class biplot will be appended with the following elements:
- Xnew.raw
the new data.
- Xnew
the matrix of the centered and scaled new numeric variables of new data.
- Xnew.cat
the matrix of the categorical variables of new data.
- Znew
the matrix of the coordinates of the new data in the biplot.
- new.group.aes
aeshetics for the new samples
For an object of class CA the following additional elements will be appended:
- newrowcoor
the matrix of row coordinates of the new data in the biplot.
- newcolcoor
the matrix of column coordinates of the new data in the biplot.