Predict samples to display on the biplot
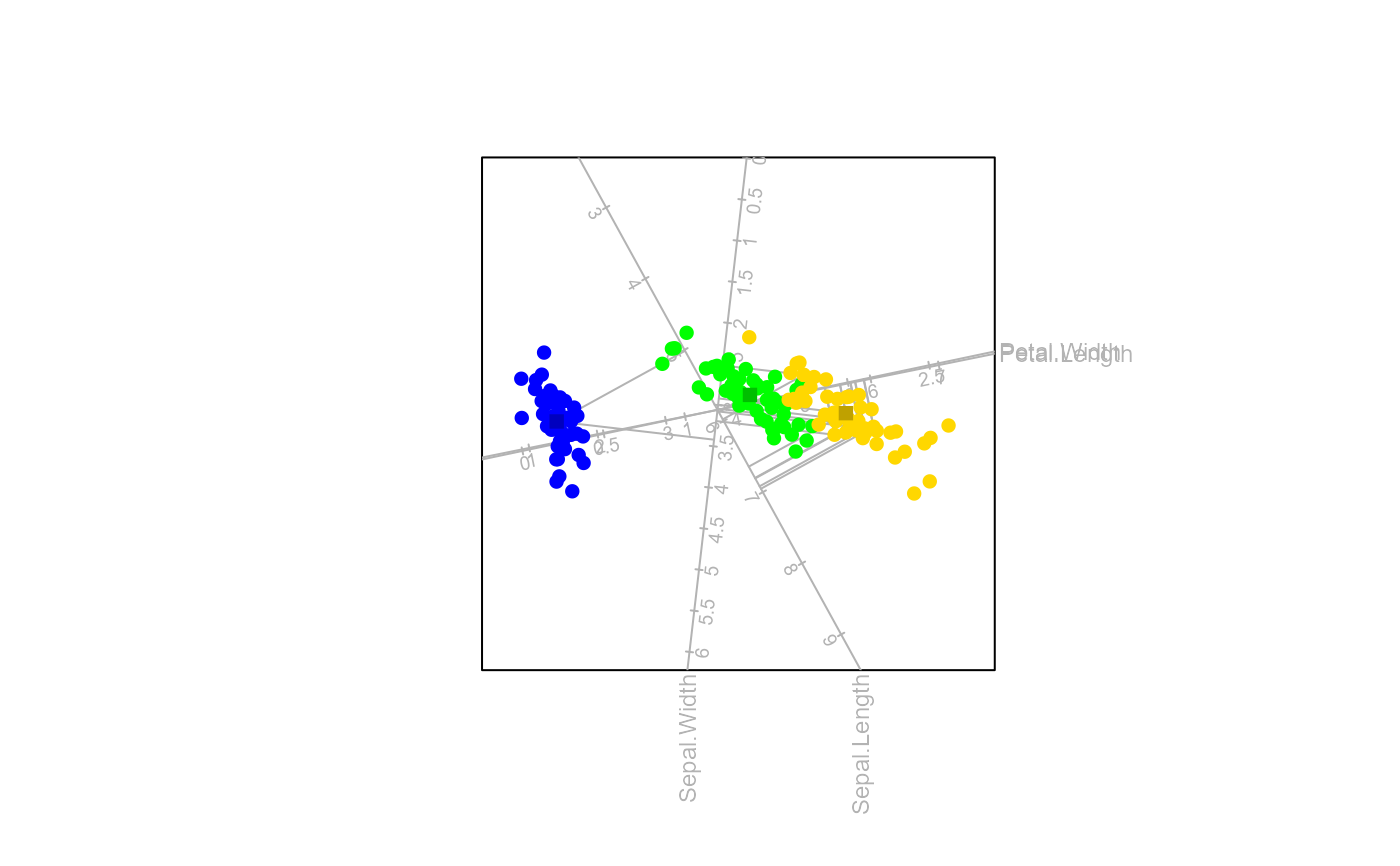
prediction.RdThis function makes predictions of sample points, variables and means and displays them on the biplot.
Arguments
- bp
an object of class
biplotobtained from preceding functionbiplot().- predict.samples
a vector specifying which samples to predict.
- predict.means
a vector specifying which group means to predict.
- which
a vector specifying which variable to do the prediction.
Value
A list object called predict appended to the object of class biplot with the following elements:
- samples
a vector of indices of samples which are being predicted.
- predict.means
a vector of group names of groups for which the means are being predicted.
- which
the vector of indices variables which are being predicted.
- predict.mat
the matrix of predicted samples.
- predict.means.mat
the matrix of predicted group means.
Examples
biplot(data = iris[,1:4]) |> PCA(group.aes=iris[,5], show.class.means = TRUE) |>
prediction(141:145,1:3) |> plot()
 #> Sample predictions for samples 141, 142, 143, 144, 145:
#> Sepal.Length Sepal.Width Petal.Length Petal.Width
#> 141 6.800 2.996 5.709 2.015
#> 142 6.807 3.194 5.334 1.857
#> 143 5.977 2.518 5.070 1.750
#> 144 6.952 3.044 5.905 2.097
#> 145 6.918 3.075 5.777 2.043
#> Class mean predictions for classes setosa, versicolor, virginica:
#> Sepal.Length Sepal.Width Petal.Length Petal.Width
#> setosa 5.014 3.420 1.461 0.238
#> versicolor 5.875 2.833 4.257 1.409
#> virginica 6.641 2.919 5.555 1.951
#> Sample predictions for samples 141, 142, 143, 144, 145:
#> Sepal.Length Sepal.Width Petal.Length Petal.Width
#> 141 6.800 2.996 5.709 2.015
#> 142 6.807 3.194 5.334 1.857
#> 143 5.977 2.518 5.070 1.750
#> 144 6.952 3.044 5.905 2.097
#> 145 6.918 3.075 5.777 2.043
#> Class mean predictions for classes setosa, versicolor, virginica:
#> Sepal.Length Sepal.Width Petal.Length Petal.Width
#> setosa 5.014 3.420 1.461 0.238
#> versicolor 5.875 2.833 4.257 1.409
#> virginica 6.641 2.919 5.555 1.951